Fri 12 May 2023
Property News | Our demographics have drastically changed, and here’s why…
If you’ve been reading our newsletter articles for a while, you’ve probably noticed that we like analysing our data and statistics, which allows us to provide better service to all our clients. This week we’ve analysed the demographics of our website visitors, many of which end up purchasing a property with us, the average price per property we’ve sold in the last 5 years and the average price per square metre in the last 5 years. Keep reading to see what we’ve found out.
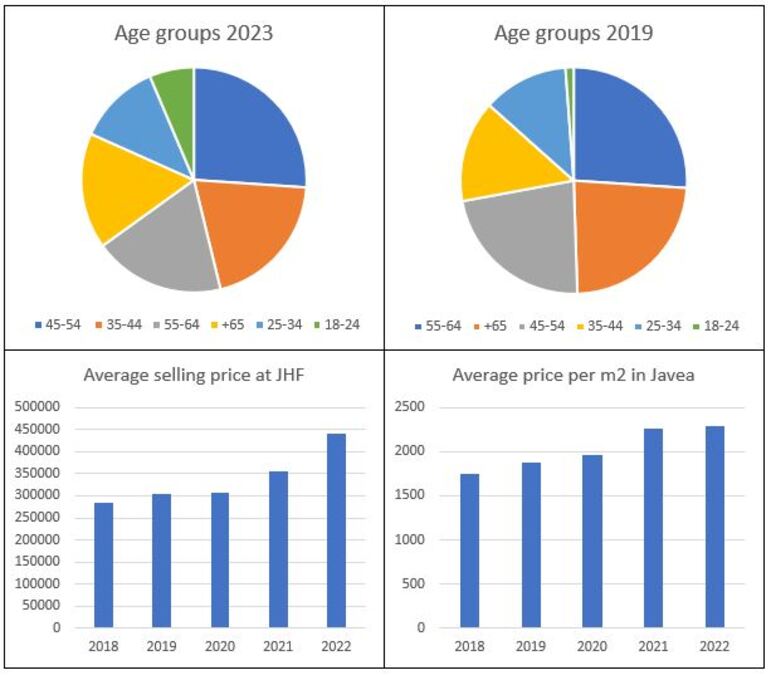
For many years, the predominant age groups visiting our website and buying properties were 55-64 and +65. Although many young people always dreamed of buying a property and then starting a family, the truth was that becoming a homeowner was not that easy 10 or 20 years ago. As you can see on the right side chart, these two age groups are about the same size and the biggest ones in the chart. However, at some point the paradigm started changing. Mortgage conditions have altered, more and more people are learning how to invest their money and salaries have increased. In addition, COVID has caused more relocations than ever due to the rising possibilities to remote work, which means people from other countries (with a higher income) can work from anywhere in the world. Consequently, more of our buyers have had the funds available at a younger age than ever before due to a greater savings capacity. This means more younger people are becoming homeowners now than in the past. Now the predominant age groups are 45-54 and 35-44 which is clear evidence of how finances have been changing in the last few years.
We have also had a look into our data regarding selling prices during the last 5 years and government statistics specific for Javea. On the left side chart above, it’s clear that prices have been steadily increasing. The trend started after 2013, but between 2021 and 2022 there was a marked increase property price. In the last 5 years, the average selling price went up by an astonishing 54%. It’s important to note that these figures are an average and include villas, apartments, and plots. Regarding prices per square metre, these are official figures released by the Government and specific for Javea. They are also an average, but a good indicator to take as a reference. The average price per square metre, as shown on the right hand graph, has also gone up, although not as much as the average selling price. By the looks of it, prices seem to be stabilising, but will they stabilise for good, or will this upward trend continue?
These are our conclusions after taking a good look at our stats and spreadsheets, and we hope we keep reassuring you about our knowledge of the market and the area. If after seeing these figures you’re interested in a valuation, please contact Valentina to arrange an appointment. And if you’d like to see what’s on the market for your budget, please contact Amber to arrange some viewings. We will be with you every step of the way!